Julie is a senior IT director in an organization. Julie and her change teams are responsible for CI changes made across a set of applications in a daily, weekly, and monthly basis. Julie has to track the success or failure of the changes by the various change teams and the impact of aforesaid changes with respect to end user business services, applications, key transactions and the generated incidents or problems arising out of these changes.
Julie wants to have a standard process to track change success and failures and gain insights on the number of configuration item changes done by application and their impact on businesses transactions and end user , application performance both for mobile app and browser users.
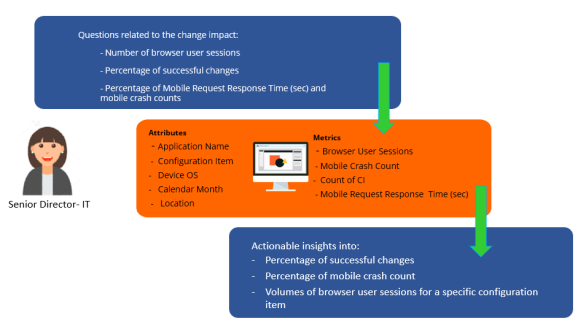
Following are some areas of focus as examples to understand the impact of changes on applications. For example, for a specific time period, did the change affect the following:
To analyze the change impact on applications, businesses, and transactions, perform the following procedures:
In this example, pie chart is used. For more information on dossiers, refer Dossiers.
 and select Existing Datasets.
In this example, Change and Mobile Application Summary iCubes are selected. The selected dataset is added to the DATASETS panel.
For more information on Monitor attributes and metrics, refer the Digital.ai Intelligence Applications User Documentation.
Drag the Location attribute and drop it into the Break By and Color By sections.
In the Break By section, select the Stacked option to change the way location is represented by application and browser user sessions.
Using the report, Julie can get the following visibility in to the performance of applications throughout the change and post-change windows:
© 2022 Digital.ai Inc. All rights reserved.